Is $80K The Next Stop After 6% Rally?

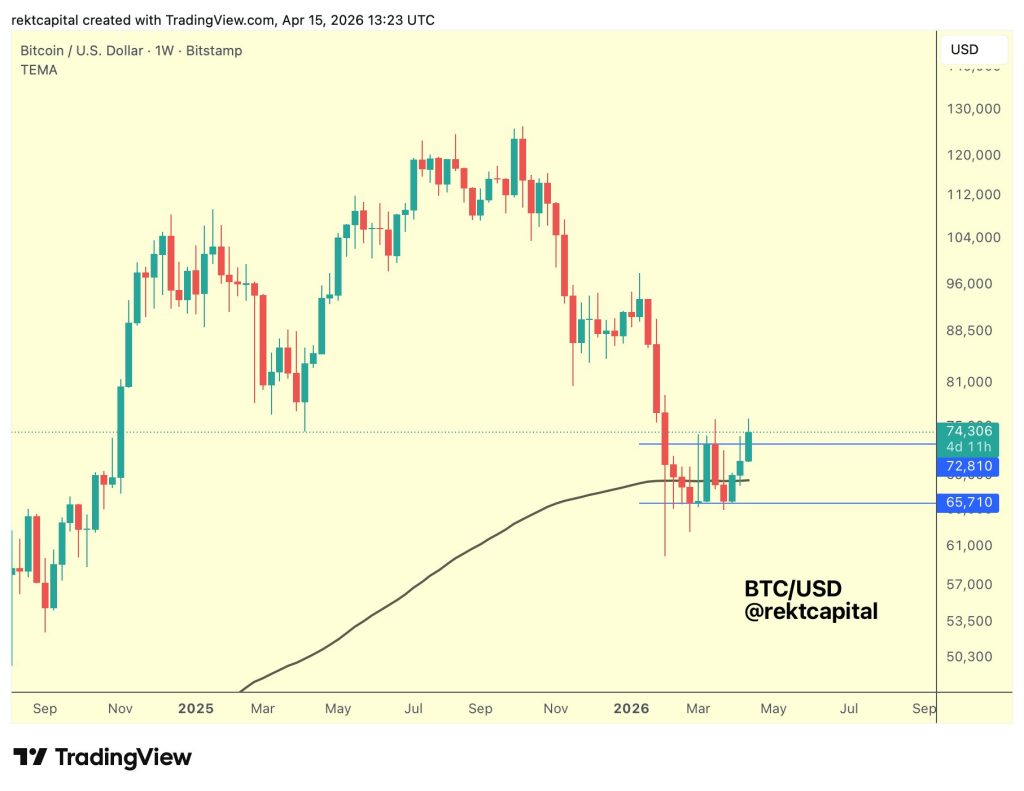
Bitcoin is pushing into a technically important area, with price tightening against resistance and a larger move in either direction looking increasingly likely. $BTC is trading around the $73,000–$74,000 range, showing a rough 5–6% short-term gain, signaling a steady recovery phase in the market. The setup looks constructive on the surface, but analysts who have navigated previous cycles know this is precisely where markets tend to be most deceptive.
$BTC Beyond the Double Bottom Formation
Crypto analyst Rekt Capital has explained that Bitcoin is attempting to break above the neckline of a developing double bottom formation near $72,810. A weekly close above this level or a successful retest could confirm a breakout, opening the path toward $81,000–$82,500.
He warns that similar setups in earlier bear-market phases have appeared convincing but ultimately failed. This means even if Bitcoin breaks out, the move could still turn into a bull trap if momentum doesn’t hold.
What Confirms the Breakout?
Analyst stresses two confirmation signals:
- A weekly close above $72,810, showing strength
- Or a retest of that level as support (price dips, holds, then moves up)
Without these, the breakout is not reliable.
These are his three main risks:
- Rejection at resistance = Price fails to break $72,810
- Fake breakout = Price breaks out but fails the retest and drops
- Weak follow-through = Price breaks out but doesn’t reach the target and loses peak
Make-or-Break Moment Builds
At the same time, crypto analyst Ali Martinez says that Bitcoin is once again testing the 100-day simple moving average, a level that has triggered major rejections in the past. Previous encounters with this resistance resulted in sharp corrections of up to 40%.
If Bitcoin faces another rejection here, it could form a triple top pattern, potentially dragging price back toward the $59,800 range. However, a clean break above this level would reinforce the bullish case and signal that the broader correction phase may be ending.
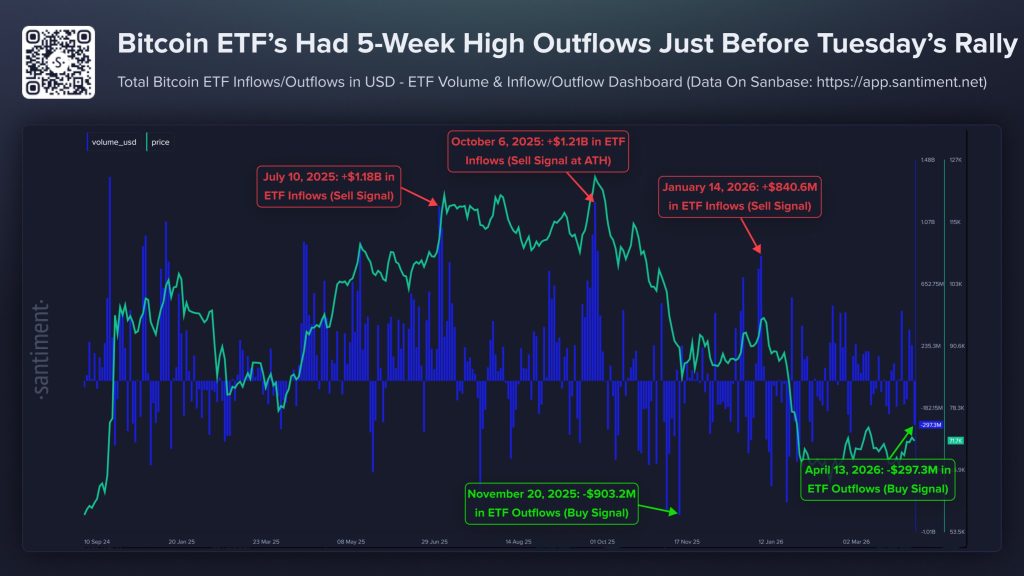
Santiment data shows nearly $297 million in Bitcoin ETF outflows, indicating rising panic among retail investors. Interestingly, such outflows have historically aligned with buying opportunities, while strong inflows tend to mark local tops.
Hence, Bitcoin can rally, but unless it proves strength after the breakout, this could turn into another bull trap rather than the start of a sustained uptrend.
Related Articles

Bitcoin traders may have reason to rejoice – Even if BTC reserves fall to 2.683 mln
Bitcoin [$BTC] exchange reserves have dropped massively, and Spot retail activity is close to recent lows. Regardless of it all, $BTC traders may have...

Solana (SOL) Upside Builds, $90 Now Key Battleground
Solana found support at $82.50 and corrected some losses. $SOL price is now consolidating above $85 and might aim for a steady increase. $SOL...

Bitcoin rally is taking a breather near $75,000. Onchain data shows why
Bitcoin has climbed nearly 10% this month, but the rally is running into resistance near $75,000. The pause is notable as U.S. stocks push...
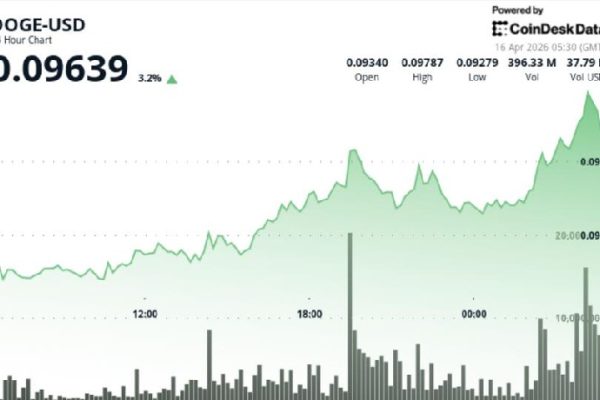
Dogecoin jumps 4.5% to nearly 10-cents, outperforming bitcoin and ether
Dogecoin is pushing higher on strong volume, but the move is still being driven more by positioning than underlying demand. The rally looks technically...