XRP Price Gains Strength, Is a Bigger Rally Brewing?
$XRP price started a decent increase above $1.3880. The price is now consolidating gains and might aim for more gains above the $1.4150 zone.
- $XRP price started a steady upward move above the $1.40 zone.
- The price is now trading above $1.40 and the 100-hourly Simple Moving Average.
- There is a bullish trend line forming with support at $1.370 on the hourly chart of the $XRP/USD pair (data source from Kraken).
- The pair could continue to move up if it settles above $1.4150.
$XRP Price Climbs above $1.40
$XRP price started a fresh upward move above $1.3550 and $1.3750, like Bitcoin and Ethereum. The price gained pace for a clear move above the $1.3880 resistance.
The bulls even pumped the price toward the $1.40 zone. A high was formed at $1.4157, and the price started a consolidation phase above the 23.6% Fib retracement level of the upward move from the $1.3510 swing low to the $1.4157 high.
The price is now trading above $1.40 and the 100-hourly Simple Moving Average. Besides, there is a bullish trend line forming with support at $1.370 on the hourly chart of the $XRP/USD pair.
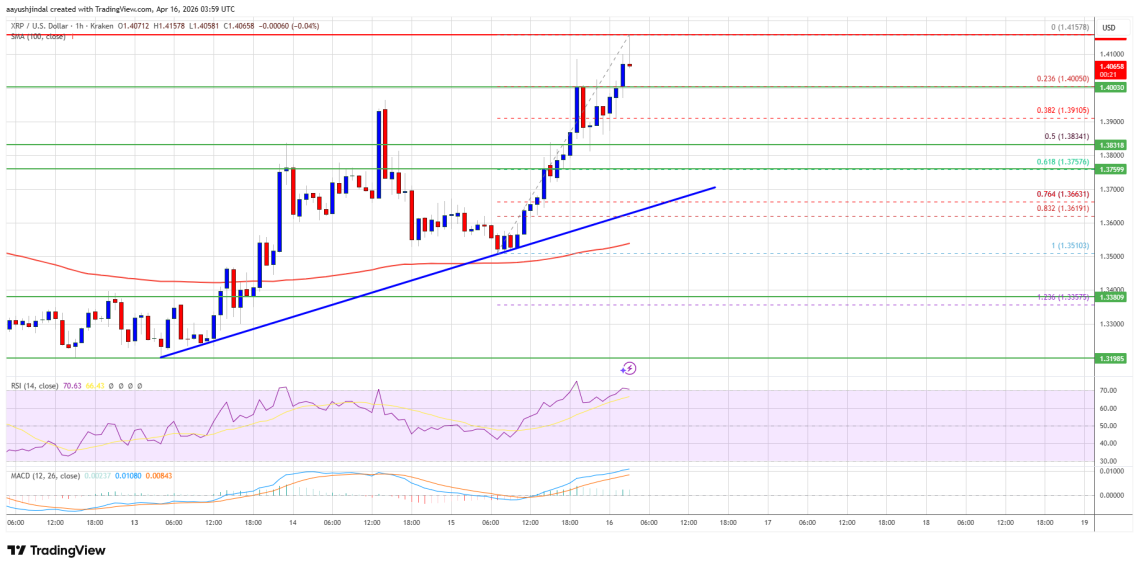
If there is a fresh upward move, the price might face resistance near the $1.4150 level. The first major resistance is near the $1.4220 level, above which the price could rise and test $1.440. A clear move above the $1.440 resistance might send the price toward the $1.450 resistance. Any more gains might send the price toward the $1.4650 resistance. The next major hurdle for the bulls might be near $1.4840.
Downside Correction?
If $XRP fails to clear the $1.4150 resistance zone, it could start a fresh decline. Initial support on the downside is near the $1.40 level. The next major support is near the $1.3840 level or the 50% Fib retracement level of the upward move from the $1.3510 swing low to the $1.4157 high.
If there is a downside break and a close below the $1.3840 level, the price might continue to decline toward $1.370 and the trend line. The next major support sits near the $1.350 zone, below which the price could continue lower toward $1.3250. The main support could be $1.3120.
Technical Indicators
Hourly MACD – The MACD for $XRP/USD is now gaining pace in the bullish zone.
Hourly RSI (Relative Strength Index) – The RSI for $XRP/USD is now above the 50 level.
Major Support Levels – $1.3840 and $1.3700.
Major Resistance Levels – $1.4150 and $1.4400.
Related Articles

Michael Saylor Revealed That His Company Has Made $1.3 Billion from Bitcoin in Just the Last Two Weeks
According to Michael Saylor, Strategy achieved significant profits from its Bitcoin ($BTC) strategy during the first two weeks of April 2026. Saylor stated that...

Bitcoin rally is taking a breather near $75,000. Onchain data shows why
Bitcoin has climbed nearly 10% this month, but the rally is running into resistance near $75,000. The pause is notable as U.S. stocks push...
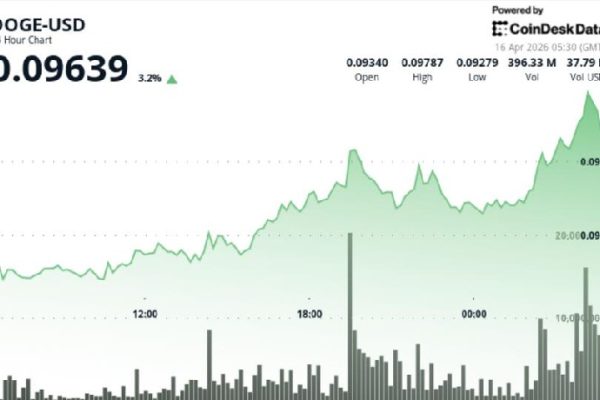
Dogecoin jumps 4.5% to nearly 10-cents, outperforming bitcoin and ether
Dogecoin is pushing higher on strong volume, but the move is still being driven more by positioning than underlying demand. The rally looks technically...

Bitcoin tests $75K as supply tightens – Will STH selling cap BTC’s rally?
This rotation between short-term selling and constrained supply begins to shape how Bitcoin behaves near resistance. As the price approaches the $73,000 to $75,000...