XLM surges above key resistance level, bullish momentum builds

Key takeaways
- Stellar is up 7% in the last 24 hours, making it the best performer among the top 20 cryptocurrencies by market cap.
- On-chain data, derivatives metrics, and momentum indicators collectively support a positive outlook
Stellar ($XLM) is showing strong performance above critical resistance levels on Tuesday, as $XLM found support around its respective resistance the previous day.
With growing on-chain activity, positive derivatives data, and bullish momentum indicators, $XLM is poised for potential upside.
Bullish sentiment backed by on-chain and derivatives data
CryptoQuant’s latest summary suggests a neutral to bullish outlook for $XLM, highlighting large whale orders and favorable conditions in spot markets.
$XLM is showing large whale orders with mostly neutral market metrics, reinforcing a bullish outlook.
On the derivatives front, $XLM is displaying positive funding rates. $XLM’s OI-Weighted Funding Rate flipped positive on Monday, reaching 0.0032% on Tuesday. This positive rate suggests a bullish market sentiment, with longs paying shorts.
$XLM is showing promising signs of continued strength as it maintains momentum toward a potential breakout.
$XLM technical outlook: Rebounds from key support
The $XLM/USD 4-hour chart is bearish and efficient as Stellar is trading at $0.1815 at press time. The coin found support around the 50-day EMA at $0.165 the previous day.
$XLM is holding a constructive near-term bias as it stabilizes above the 50-day EMA and the broken descending trendline that now offers secondary support near $0.153.
The current momentum indicators suggest that $XLM could rally higher in the near term. The RSI on the 4-hour chart reads 71, just below the overbought territory. The MACD line is tracking above zero, suggesting buyers retain control while price stays capped above the 100-day EMA at $0.179.
If the rally persists, immediate resistance would be found at the 4-hour TLQ of $0.194, followed by a more substantive barrier at the 23.6% Fibonacci retracement of the broader downswing at $0.201.
A daily candle close above these levels would expose the 200-day EMA at $0.215, which defines a key medium-term hurdle.
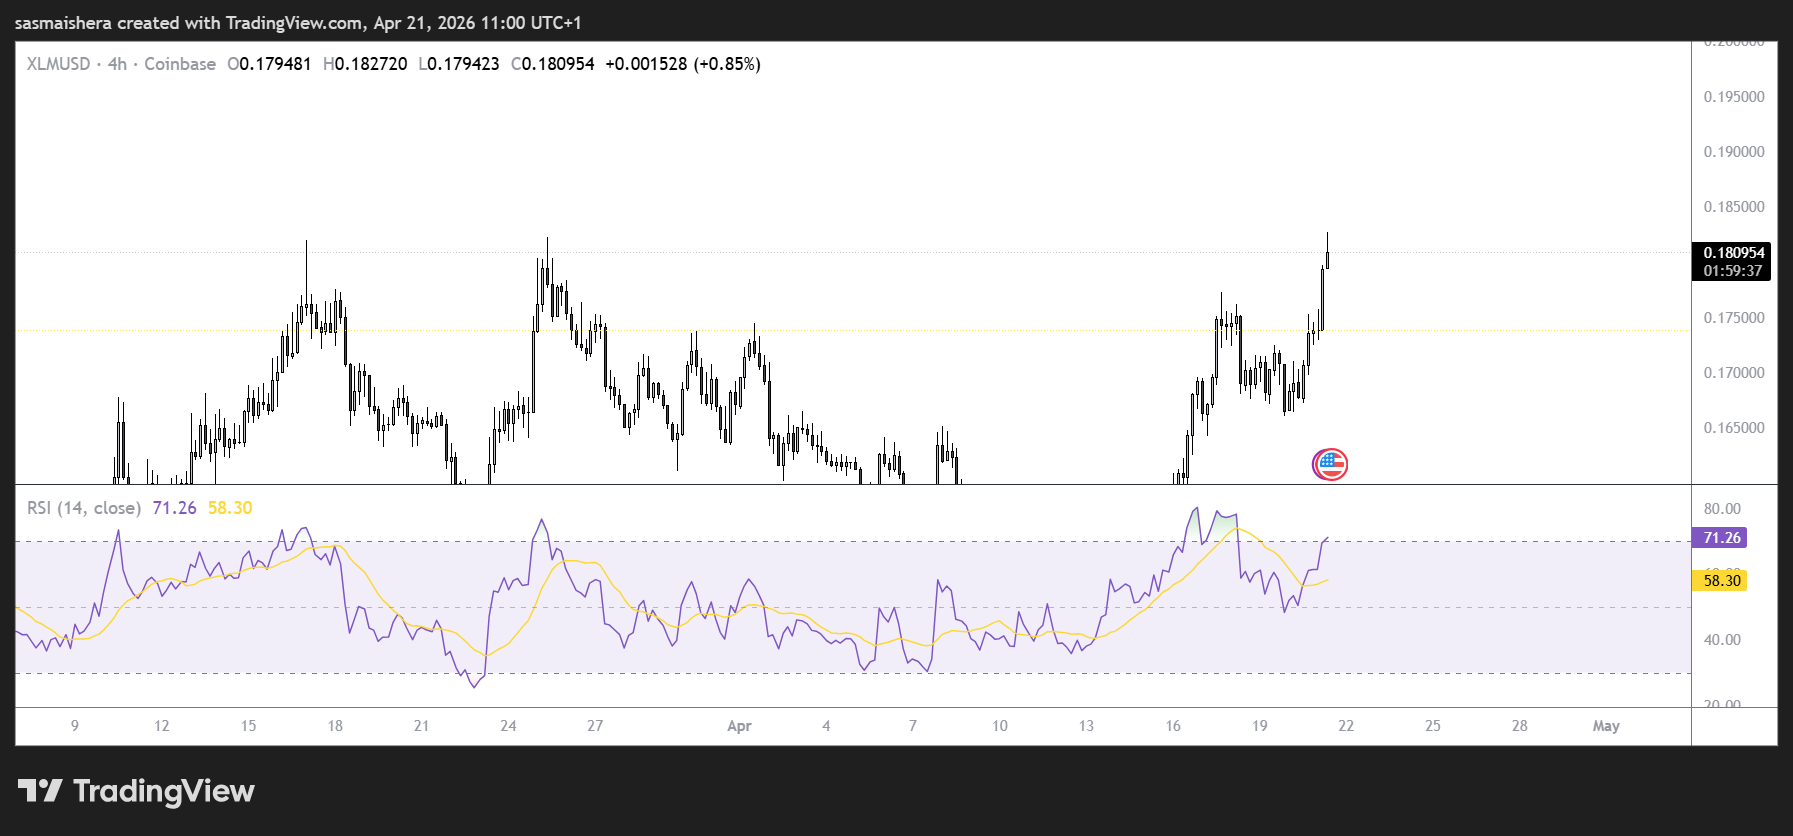
On the downside, initial support is seen at the 100-day EMA of $0.179, with another major demand zone at the day’s open near $0.173.
An extended bearish performance would expose the 50-day EMA at $0.165, with deeper protection at the former descending resistance line-turned-support around $0.153.
Related Articles

Why XRP Price is Outperforming Bitcoin and Ethereum This Week?
Why XRP Price is Outperforming Bitcoin and Ethereum This Week?

JPMorgan outlines S&P500 path to 8,000 in 2026
On Tuesday, April 21, the banking giant JPMorgan (NYSE: JPM) elected to swap caution voiced in mid-March with decisive optimism regarding the performance of...
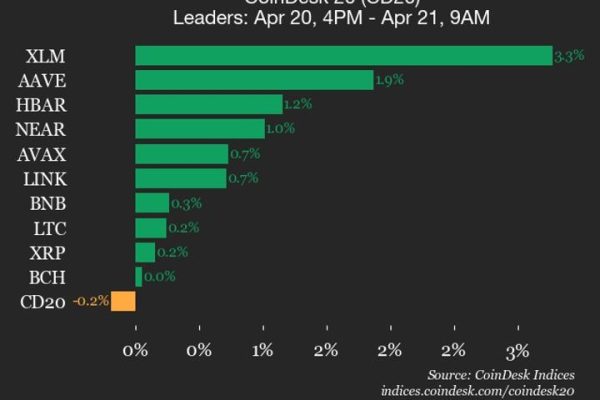
Stellar (XLM) gains 3.3% while index moves lower
CoinDesk Indices presents its daily market update, highlighting the performance of leaders and laggards in the CoinDesk 20 Index. The CoinDesk 20 is currently...

Morgan Stanley scoops up over $16 million of this crypto
American banking giant Morgan Stanley (NYSE: MS) has continued its aggressive push into cryptocurrency through the recent launch of its spot Bitcoin ($BTC) exchange-traded...