Memecore’s rejection at $3 traps bulls: Here’s what happens next

A notable shift in the price of Memecore [M] was recorded today. According to the CoinMarketCap data, M initially surged over 5.50% but later dropped by 3.5%, raising questions about the sudden decline.
Several factors appear to be the key drivers behind the M token’s price dip, including a reversal from a key resistance level, a sell-off by long-term holders, and bearish bets by traders.
Memecore: Price action hints at a potential 23% fall
On the daily chart, M appeared to have made a strong bullish fakeout, trapping bulls, as it broke the key $3 resistance level it had been facing since the 18th of September, 2025.
However, after hitting an all-time high, the price dipped sharply and appeared to be reversing, similar to what was seen in September 2025 and November 2025, when the asset plummeted by over 46% and 58%, respectively.
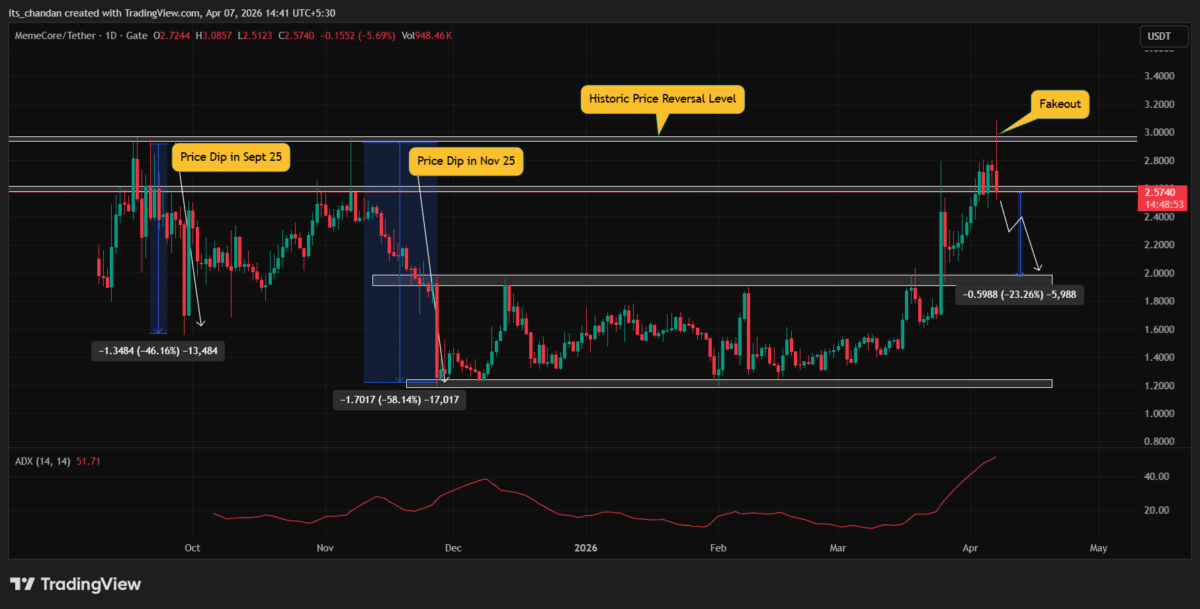
Looking at the current price action, if M closes a daily candle below the $2.60 level this time, there is a strong possibility that it could repeat its past pattern and see a price drop of 23%, potentially reaching the $1.98 level.
However, an upside rally would only be possible if M closes its daily candle above $3.
At press time, the technical indicator Average Directional Index (ADX), which measures trend strength, has risen to 51.71—well above the key threshold of 25—indicating a strong directional trend in the market.
M Token: Investor and trader sentiment turns bearish
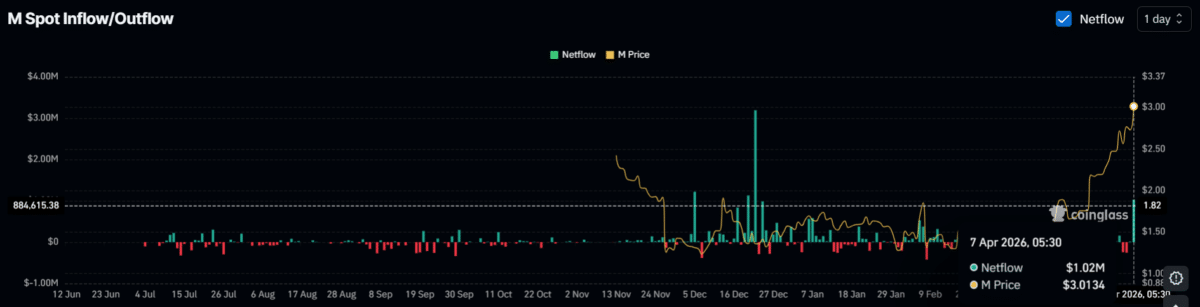
According to M’s Spot Inflow/Outflow data, a massive $1.02 million worth of assets has moved into exchanges over the past 24 hours, indicating preparation for a potential sell-off.
This exchange inflow appears to be its highest level since December 2025, suggesting that investors may be taking advantage of the recent price jump and booking profits near a key resistance level that has a history of reversals.
Traders also appeared to be following the same trend. The exchange liquidation map data showed that $2.514 and $3.039 were two major levels where traders were overleveraged, with $361K worth of long positions and $1.14 million worth of short positions built at these levels.
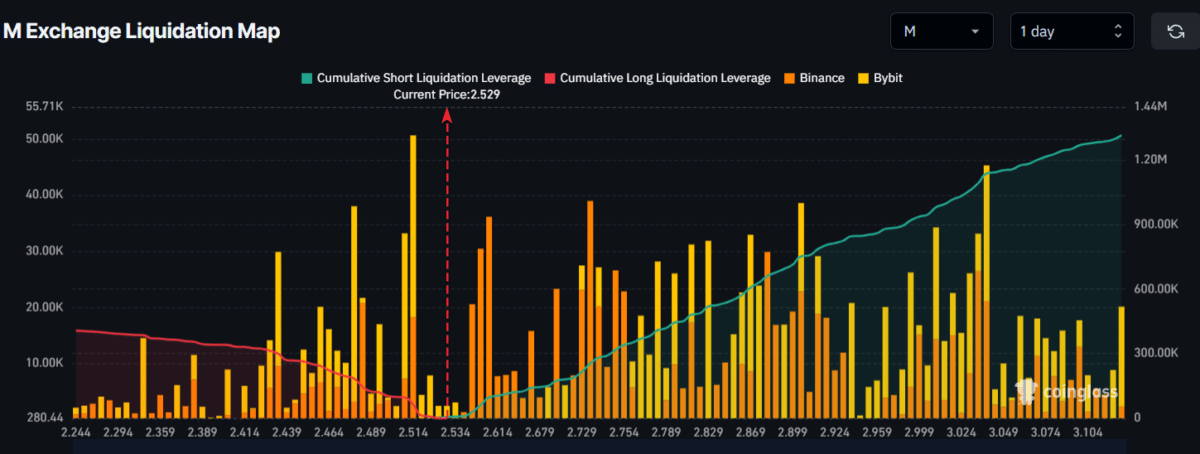
So, M’s price looks unlikely to climb to the $3.039 level anytime soon.
Final Summary
- Memecore is poised for a 23% price dip and appears to be repeating its historical pattern near the key resistance level of $3.
- M’s long-term holders have sent $1.02 million worth of assets to exchanges, indicating preparation for a potential sell-off.
Related Articles

TitanRWA Taps GoldFinger to Broaden Gold-Driven RWA Tokenization
TitanRWA, a blockchain-based RWA tokenization platform, has partnered with GoldFinger, a blockchain entity for gold’s tokenization into digital assets. The partnership aims to connect...

DEXE dumps 15% as seller dominance surges – Warning sign?
$DEXE fell sharply even as the broader crypto market rebounded on easing global tensions and ceasefire talks. The altcoin dropped from $9.2 to $7.3...

KOFIA Chairman Demands South Korea Join Global Financial Trend
In a significant development for Asian financial markets, Korea Financial Investment Association (KOFIA) Chairman Hwang Seong-hyeop has publicly called for South Korea to introduce...
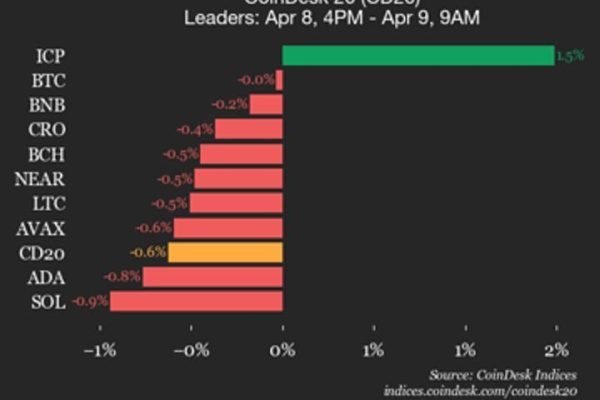
Bitcoin (BTC) trades flat as index declines
CoinDesk Indices presents its daily market update, highlighting the performance of leaders and laggards in the CoinDesk 20 Index. The CoinDesk 20 is currently...