Keeta rallies 36% in a day – Should KTA holders take profits now?
The $109 million market cap altcoin Keeta [$KTA] experienced a 36.7% rally in the past 24 hours, at press time. CoinMarketCap data showed that it had a 400% surge in daily trading volume as traders and investors raced to capture some gains the altcoin was posting.
These gains came at a time of wider market uncertainty and drawdown. Bitcoin [BTC] faced rejection from the $76k level in the past two weeks and retested the $66k level as support on Tuesday, the 31st of March.
Can $KTA keep its rally going, or is this rally one for holders to sell?
Right time to take profits?
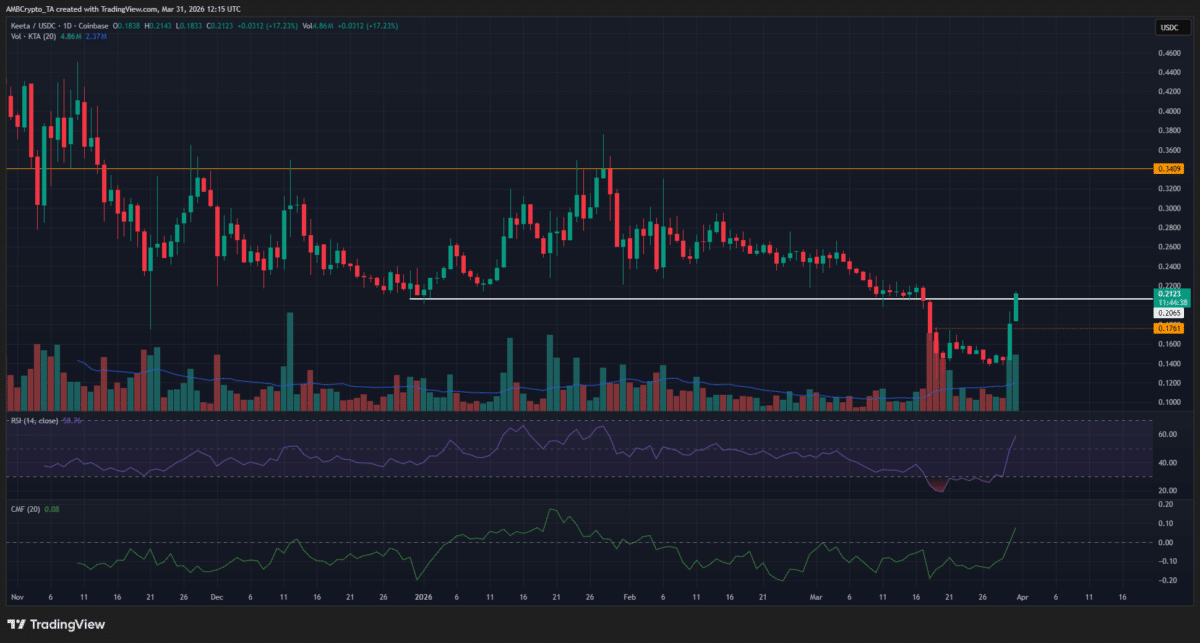
The 1-day chart of the altcoin showed the breakdown below the $0.2 support zone in mid-March. The trading volume on Wednesday, the 18th of March, was the highest single-day volume since Friday, the 12th of December 2025.
The high-volume breakdown below a support level that has held throughout 2026 was significant.
Yet, at the time of writing, $KTA was poking its head back above the same resistance zone, which coincides with a psychological round number resistance.
The CMF climbed to +0.08 to indicate heavy buying pressure and sizeable capital inflows. It must be noted that the daily CMF has been negative since the market crash in the first week of February.
Meanwhile, the daily RSI has also recovered to push past neutral 50. This indicated sustainable upward momentum.
Traders’ call to action: Sell!
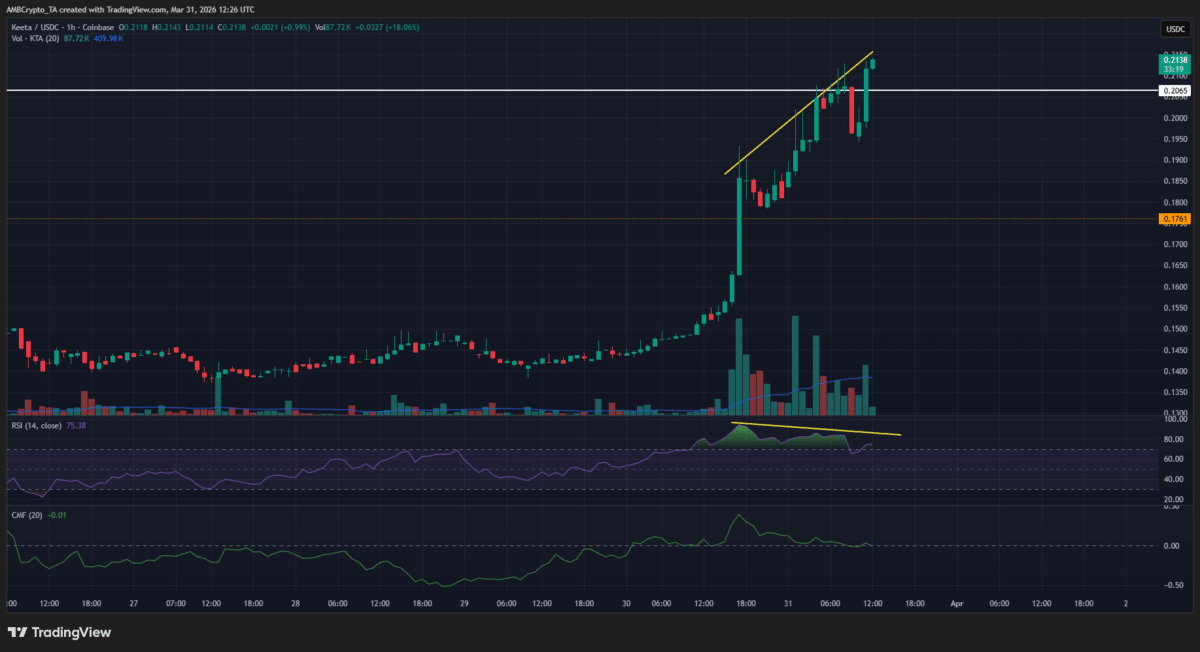
The 1-hour chart showed bullish volume and momentum indicators, but the run could be ending. While the 1-day chart stressed a bearish long-term structure, the 1-hour chart hinted at a pullback toward the $0.176 level, a support from earlier in March.
The CMF was back below +0.05 and, more importantly, the RSI was making a bearish divergence.
This was a clear sign that short-term holders should consider taking profits. As things stand, the longer-term bias means that they should be wary of buying a pullback and expect further losses instead.
Final Summary
- Keeta saw a 36% rally in the past 24 hours and was back above a support level it lost to the bulls in mid-March.
- The lower timeframe price chart showed that a pullback is likely, and there was a clear momentum divergence in progress.
Related Articles

Crypto RWA Perpetuals Challenge TradFi Market Share
Crypto-native perpetual markets tied to real-world assets ( RWA) are rapidly gaining traction against traditional futures. New data shows sharp growth in trading volumes...

Bitcoin Price Trims Gains, But Uptrend Still Holds Strong
Bitcoin price started a strong increase above the $70,500 zone. $BTC is consolidating gains and might aim for more gains above the $71,650 zone....

Cardano price tests $0.25 support as long liquidations mount, will it crash?
Cardano price fell over 5% towards $0.25 on Thursday, paring off a part of its gains seen on the previous day. According to data...

Crypto Built More Rails, but the Next Battle Is Over How Much Work a Dollar Can Do
Most people think the problem with modern finance comes down to fees, spreads, and slow transfers. Those are real, but the deeper issue feels...