Is ETH About to Break Out of Consolidation?
Ethereum is still locked in a broad corrective structure. The price action shows continued indecision rather than directional conviction, which seems fair given the escalations in the Middle East. Despite holding above the $1.8k support base, upside attempts are consistently capped before any meaningful trend shift can develop.
Ethereum Price Analysis: The Daily Chart
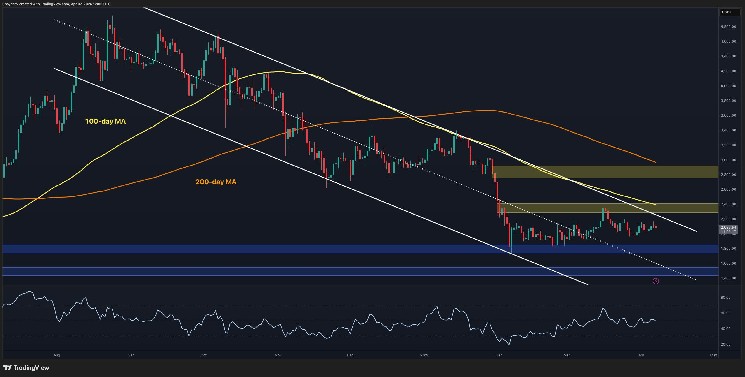
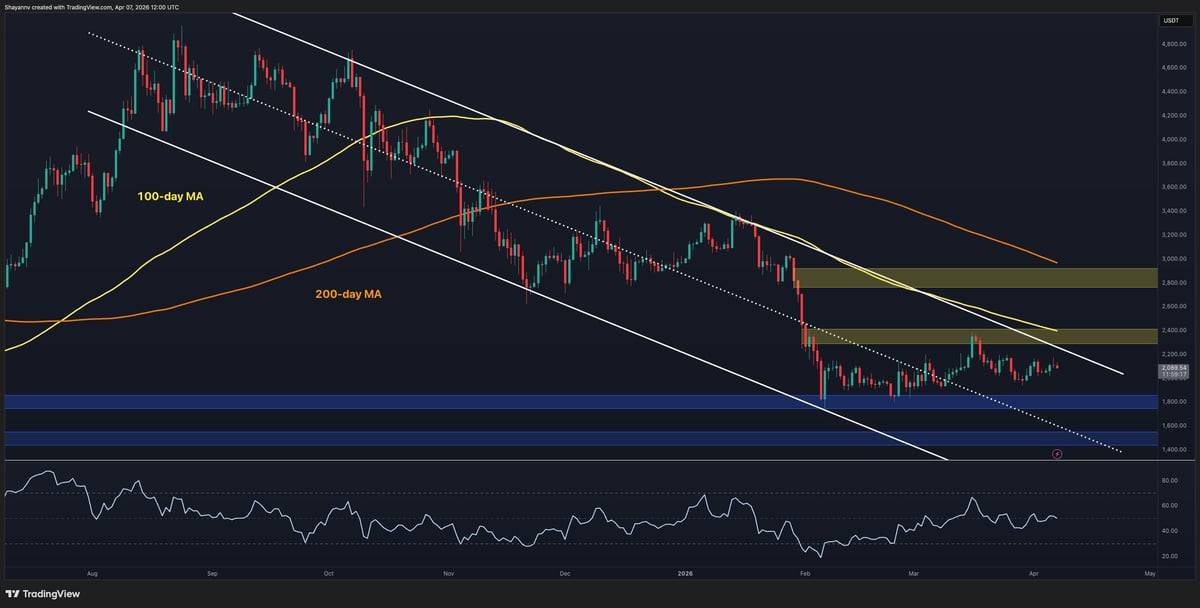
On the daily timeframe, $ETH is still trading within a large descending channel. This confirms a broad bearish market structure that began in late 2025. The price also remains below both the 100-day (~$2.4k) and 200-day ($3k) moving averages, which continue to trend downward and act as dynamic resistance layers.
Currently, the $2.3k–$2.4k zone is the key supply area. This region has repeatedly rejected price and aligns with the most recent bearish order block on the daily timeframe. Meanwhile, the $1.8k region acts as a critical support area. This level has held multiple times, and as long as it holds, the downside remains contained within the current range.
A decisive break above $2.4k would invalidate the sequence of lower highs and potentially shift the structure toward a bullish reversal, as it would also mean a break above both the descending channel’s higher boundary and the 100-day moving average. Conversely, losing the $1.8k demand zone would likely trigger a breakdown from the range and open the door for a deeper move toward the next support level at $1.6k.
$ETH/USDT 4-Hour Chart
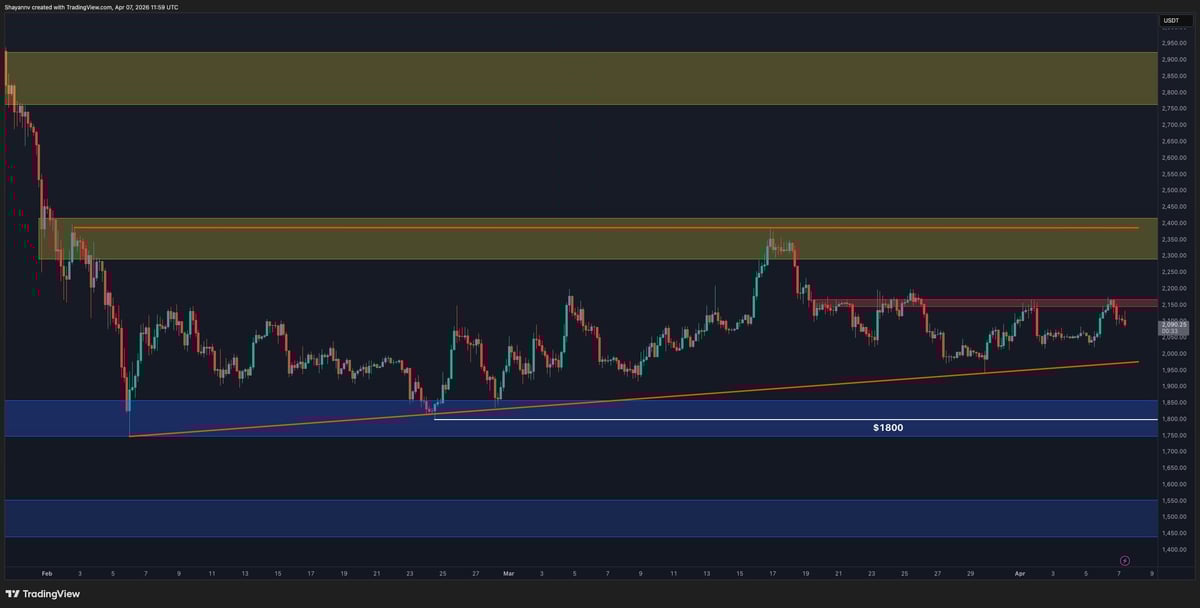
On the 4-hour timeframe, $ETH is consolidating within a narrowing triangle structure. This pattern is defined by a rising trendline from the $1.8k lows and the key horizontal resistance around $2.4k.
The price is currently trading around $2.1k. It has repeatedly tested the $2.2k short-term resistance zone formed with recent 4-hour timeframe highs, but has failed to break through it with conviction. With the lower trendline of the triangle also converging from below, the structure suggests compression, and a breakout is becoming increasingly likely.
If buyers manage to flip $2.2k into support, the next move would likely target the key $2.4k supply zone. However, failure to break higher and a loss of the ascending trendline would shift momentum bearish, exposing the $1.8k support area in the coming weeks.
Sentiment Analysis
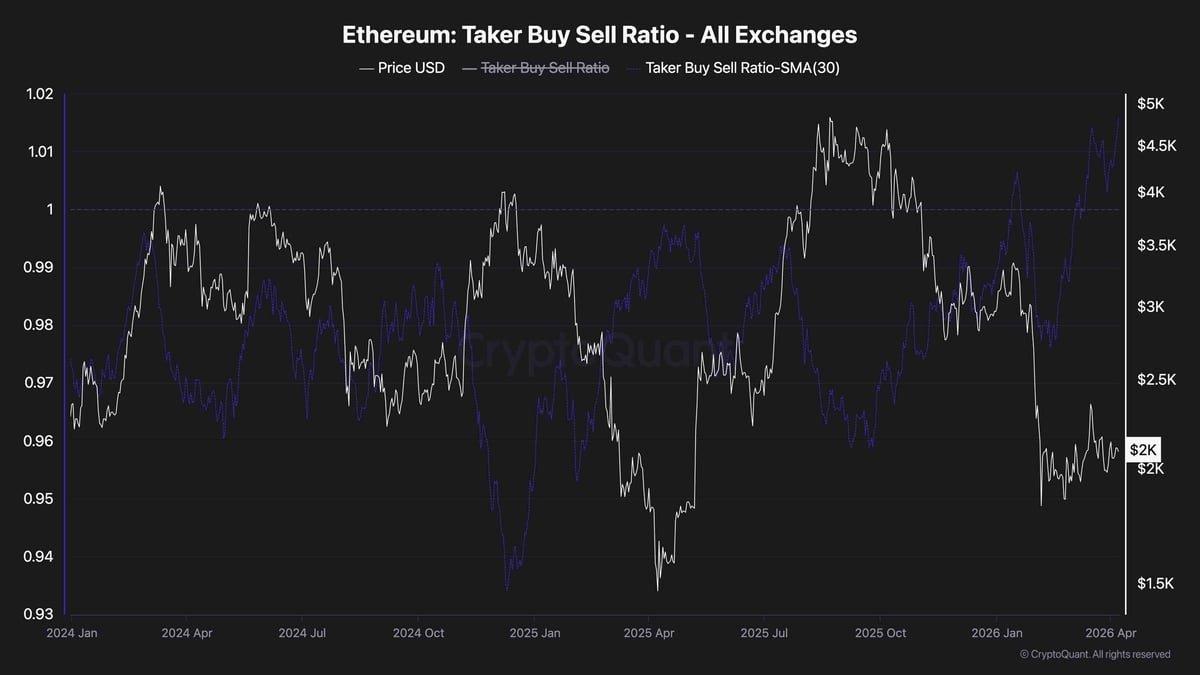
The Taker Buy/Sell Ratio is currently pushing higher and has been showing consistent readings above 1 over the past month. This indicates that aggressive buyers are becoming more active in the market.
However, this increase in taker buy pressure is occurring within a broader downtrend and range environment. Historically, similar spikes have often appeared near local tops or during short-term relief rallies, rather than marking the beginning of sustained uptrends.
This suggests that while short-term sentiment is improving, it may be driven more by speculative positioning than strong spot demand. As a result, if price fails to break the $2.4k resistance soon, this buildup of aggressive longs could unwind, leading to significant downside volatility, which could further prolong the overall bearish trend.
Related Articles

KOFIA Chairman Demands South Korea Join Global Financial Trend
In a significant development for Asian financial markets, Korea Financial Investment Association (KOFIA) Chairman Hwang Seong-hyeop has publicly called for South Korea to introduce...

Enjin Coin Price Surges 74% on Volume Spike, ENJ Rally Faces Cool-Off
Enjin Coin recorded a sharp surge over the past 24 hours, rising 74.66% to trade near $0.0353. The move stood out in a largely...

Zcash explodes 23% – But a bigger move may be coming
Zcash’s [$ZEC] move starts with price, yet the drivers extend beyond a simple rally. $ZEC’s price rose to $329, gaining 23% in 24 hours...

SOL may drop below $80 amid ETF outflows and bearish derivatives data
The cryptocurrency market has switched bearish over the past 24 hours following the excellent start to the week. Solana’s $SOL has extended its correction...