Bitcoin Price Rebounds Above $67K as Extreme Fear Grips Market

Bitcoin Price has staged a sudden recovery over the past twenty-four hours, currently trading at $67,455, representing a 1.4% intraday gain. The recovery rally provided a brief moment of relief for a market downturn of 1.3% drawdown on the weekly timeframe. Despite the short-term turbulence, $BTC remains fundamentally anchored thanks to a 5.3% gain over the broader monthly period.
There is also an increased activity among traders as $BTC generated a trading volume of $31.33 billion in the last 24-hours. What remains to be seen is how Bitcoin will react to the geopolitical issues and global economic unrest.
Institutional Outflows Flash Warning
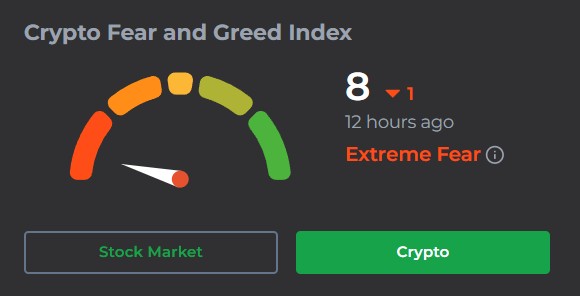
The global market structure is in severe distress, as the cloud of uncertainty is still heavy for both retailers and institutions. The Crypto Fear and Greed Index has dropped to a reading of 8, a level that firmly shows the state of absolute “Extreme Fear.” Such a low level historically leads to liquidations of holdings and positions among the majority of traders to preserve their capital.
Another example of liquidations is the daily spot ETF outflows. On the 27th of March, Bitcoin ETFs saw a net outflow of $225.48 million, with BlackRock’s IBIT ETF single-handedly recording a net outflow of $201.5 million.
The capital flight suggests traditional finance allocators are de-risking their portfolios in volatile assets to seek a safe haven in traditional assets.
Examining Bitcoin Price Chart
The 15-minute Bitcoin price chart reveals an aggressive technical offense by the bulls with a classic liquidity sweep. Previously, Bitcoin suffered a breakdown as it slid through a descending triangle pattern, moving towards the $65,000 psychological support zone. Instead of acting like the start of capitulations, the move acted as a liquidity magnet.
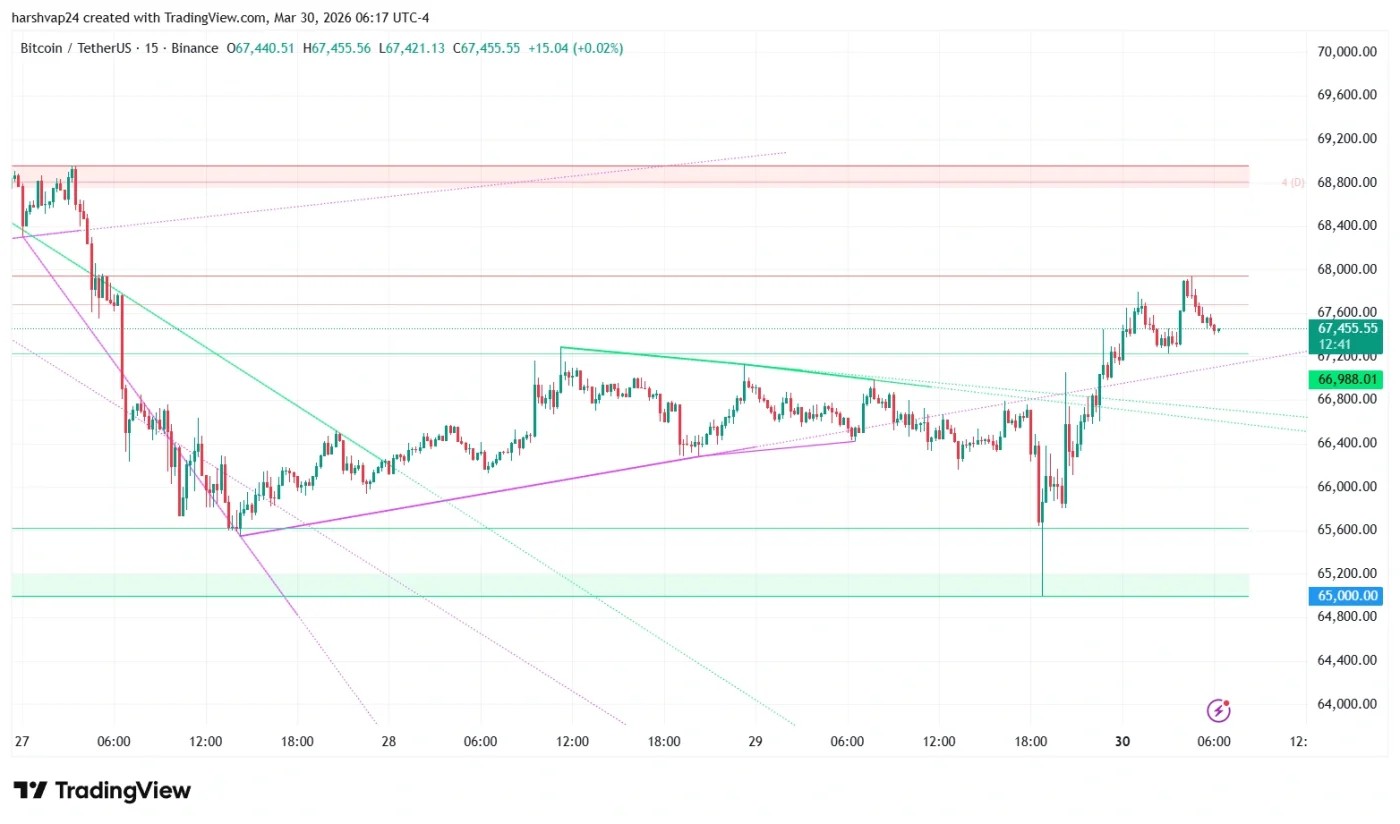
Buyers stepped in with a massive volume at the $65,000 floor and initiated a V-shaped recovery that reversed the bearish trend. Bitcoin price has now broken above the descending resistance trendlines that had previously prevented upward momentum.
The sudden uptick has shifted the Exponential Moving Average (EMAs) from a bearish to a bullish outlook. The 5, 9, 12 period moving average lines have crossed over with the 21, 50, 200 period moving average lines, suggesting a change in intraday momentum.
How Will $BTC Price Move?
The market is in a difficult position as it is balancing the reality of heavy institutional ETF outflows and the onset of a bullish momentum. Buyers should wait for Bitcoin to successfully hold the $67,000 level as the immediate support before entering a trade. If the price action successfully defends this level, the next logical target would be the $68,800 resistance zone.
Sellers are relying on the extreme fear indicator as the basis for a downward turn. If the current V-shaped recovery is merely a dead-cat bounce or a temporary short-covering rally, $BTC could fall to the liquidity pool near the $65,000 zone.
Related Articles

TitanRWA Taps GoldFinger to Broaden Gold-Driven RWA Tokenization
TitanRWA, a blockchain-based RWA tokenization platform, has partnered with GoldFinger, a blockchain entity for gold’s tokenization into digital assets. The partnership aims to connect...

DEXE dumps 15% as seller dominance surges – Warning sign?
$DEXE fell sharply even as the broader crypto market rebounded on easing global tensions and ceasefire talks. The altcoin dropped from $9.2 to $7.3...

KOFIA Chairman Demands South Korea Join Global Financial Trend
In a significant development for Asian financial markets, Korea Financial Investment Association (KOFIA) Chairman Hwang Seong-hyeop has publicly called for South Korea to introduce...
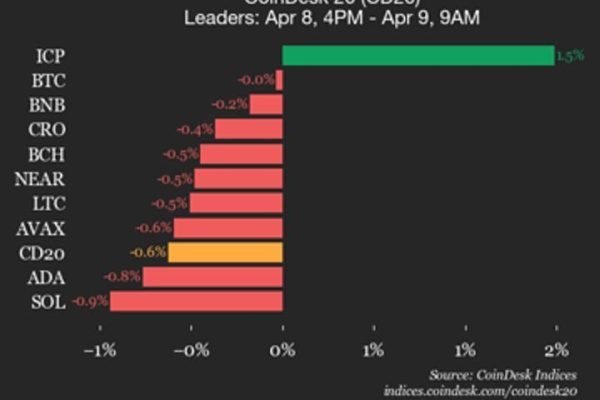
Bitcoin (BTC) trades flat as index declines
CoinDesk Indices presents its daily market update, highlighting the performance of leaders and laggards in the CoinDesk 20 Index. The CoinDesk 20 is currently...