XRP shows a growing risk of a deeper correction: check forecast

$XRP, like other leading cryptocurrencies, is under renewed pressure this week.
The coin slipped below $1.31 on Tuesday, with fading trader interest, weakening derivatives metrics, and deteriorating technical structure, suggesting downside risk for $XRP.
There is a potential for a deeper correction in the near term, with the ongoing crisis in the Middle East piling pressure on the broader crypto market.
On-chain data signals fading investors’ interest
At the moment, Santiment’s Social Dominance metric for $XRP supports a bearish forecast.
The metric measures the share of $XRP– and XLM-related discussions across the cryptocurrency media.
$XRP has been in a downtrend over the past two weeks, and its Santiment Social Dominance index now reads 0.058%.
This fall indicates fading market interest and sentiment among $XRP investors.
On the derivatives side, metrics for $XRP remain bearish.
$XRP’s futures Open Interest (OI) at the exchange dropped to $2.35 billion on Tuesday and has been steadily falling since early January.
This drop in OI for $XRP reflects waning investor participation.
Furthermore, the funding rate for $XRP supports a bearish bias.
The metric flipped to a negative rate earlier today and currently reads -0.0005%.
This negative rate indicates shorts are paying longs, suggesting bearish sentiment toward $XRP.
Technical outlook: momentum indicators show bearish signs
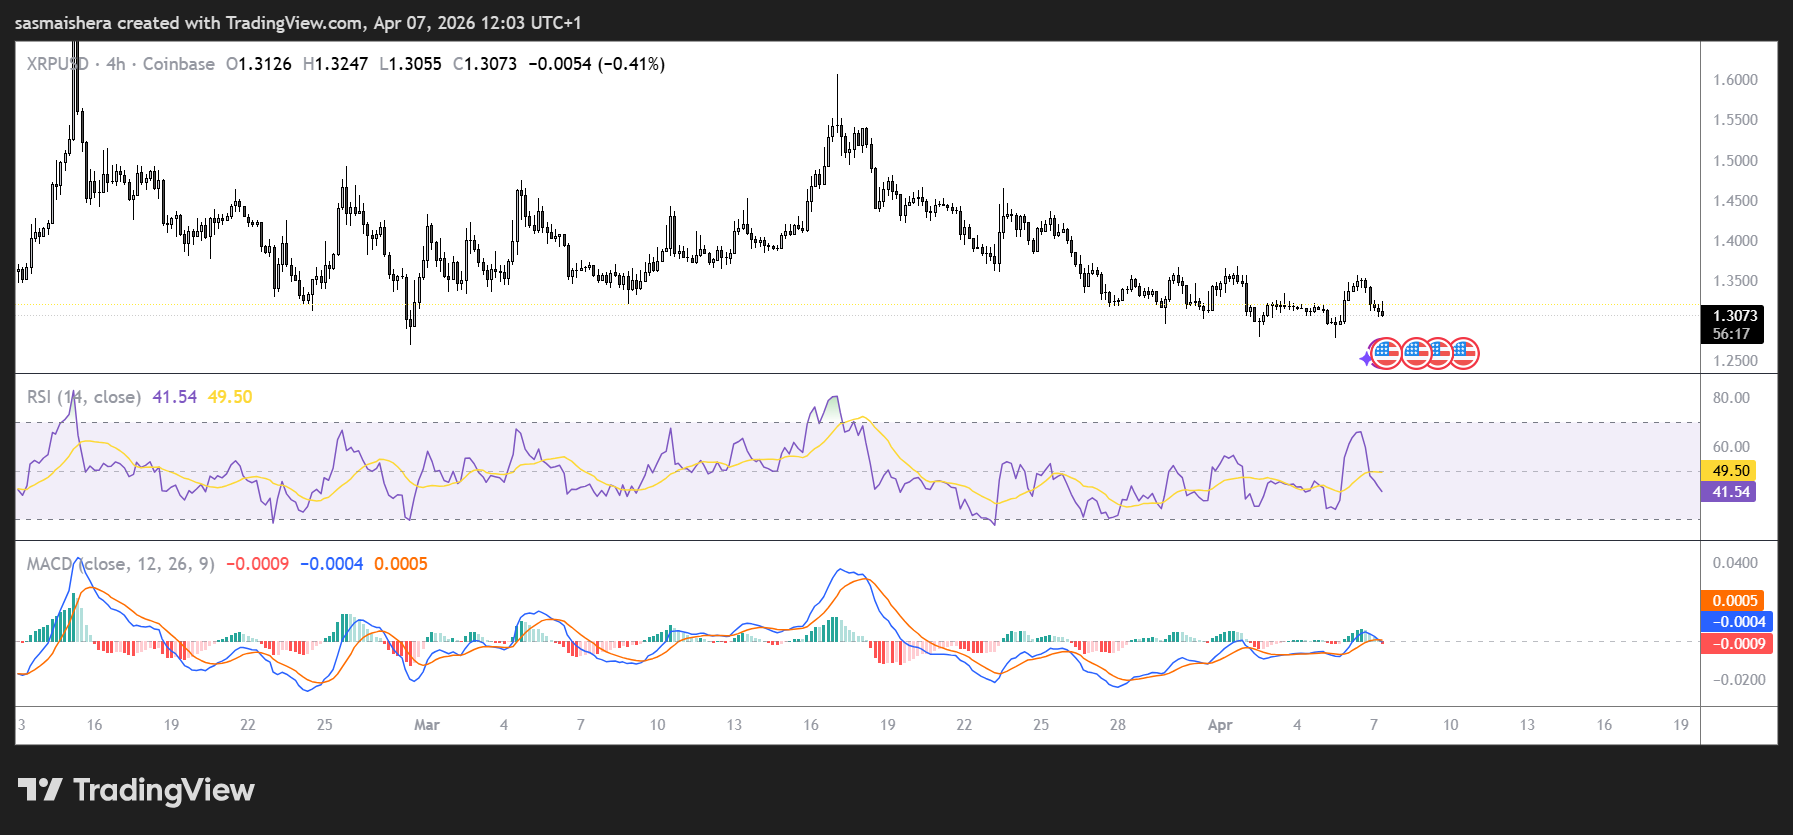
The $XRP/USD 4-hour chart is extremely bearish and efficient.
$XRP has lost its fourth place in the market to BNB and could record further losses if the market momentum persists.
At press time, $XRP is trading at $1.3045 after a mild correction on Monday.
Currently, $XRP remains embedded in a descending parallel channel from above $2.80, keeping the near-term bias bearish despite the recent stabilisation around $1.30.
$XRP is trading below the 50-day, 100-day and 200-day Exponential Moving Averages, which continue to slope lower and cap recovery attempts within the broader downtrend.
The momentum indicators also show growing bearish momentum.
The Relative Strength Index (RSI) on the 4-hour chart, around 49, remains below the midline, reflecting subdued buying interest and aligning with persistent downside pressure.
The Moving Average Convergence Divergence (MACD) indicator also remains below the zero line, suggesting a dominant bearish phase.
At the moment, $XRP is testing the $1.30 support level. If the bulls fail to defend this zone, the bears would likely push the price lower and expose the channel bottom around $0.97.
However, if the $1.30 support level holds, $XRP would need to reclaim the 50-day EMA near $1.42 to ease downside pressure. This would open the way toward initial resistance at $1.79.
A sustained rally move above that resistance level would then target the higher resistance band around $1.90, where sellers previously emerged.
Currently, the market continues to whipsaw as the US-Iran crisis lingers on.
Investors are awaiting the deadline set by President Trump for Iran before committing more positions in the market.
Related Articles

TitanRWA Taps GoldFinger to Broaden Gold-Driven RWA Tokenization
TitanRWA, a blockchain-based RWA tokenization platform, has partnered with GoldFinger, a blockchain entity for gold’s tokenization into digital assets. The partnership aims to connect...

DEXE dumps 15% as seller dominance surges – Warning sign?
$DEXE fell sharply even as the broader crypto market rebounded on easing global tensions and ceasefire talks. The altcoin dropped from $9.2 to $7.3...

KOFIA Chairman Demands South Korea Join Global Financial Trend
In a significant development for Asian financial markets, Korea Financial Investment Association (KOFIA) Chairman Hwang Seong-hyeop has publicly called for South Korea to introduce...
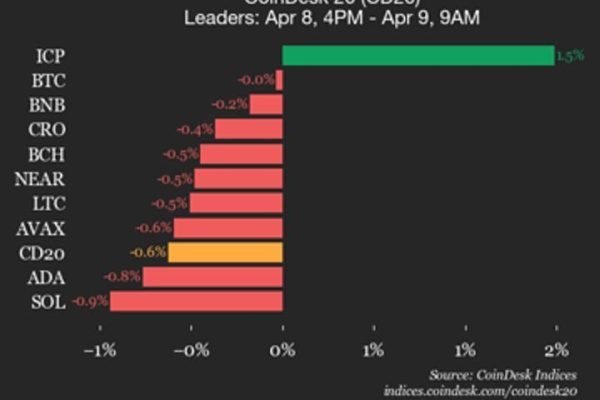
Bitcoin (BTC) trades flat as index declines
CoinDesk Indices presents its daily market update, highlighting the performance of leaders and laggards in the CoinDesk 20 Index. The CoinDesk 20 is currently...