Bitcoin Price Rejected Above $70K, Bulls Lose Grip on Momentum

Bitcoin price started a decent increase above the $68,800 zone. $BTC is trimming gains and might revisit the $67,500 support zone.
- Bitcoin gained pace for a move above the $68,500 and $68,800 levels.
- The price is trading above $68,000 and the 100 hourly simple moving average.
- There is a bullish trend line forming with support at $67,500 on the hourly chart of the $BTC/USD pair (data feed from Kraken).
- The pair might extend losses if it stays below the $69,250 and $69,500 levels.
Bitcoin Price Trims Gains
Bitcoin price managed to climb higher above the $68,000 resistance zone. $BTC gained pace for a move above the $68,500 and $68,800 levels.
The price even climbed above $70,000 but failed to remain in a positive zone. A high was formed at $70,463, and the price started a downside correction. There was a move below the 23.6% Fib retracement level of the upward move from the $65,688 swing low to the $70,463 high.
Bitcoin is now trading above $68,000 and the 100 hourly simple moving average. There is also a bullish trend line forming with support at $67,500 on the hourly chart of the $BTC/USD pair.
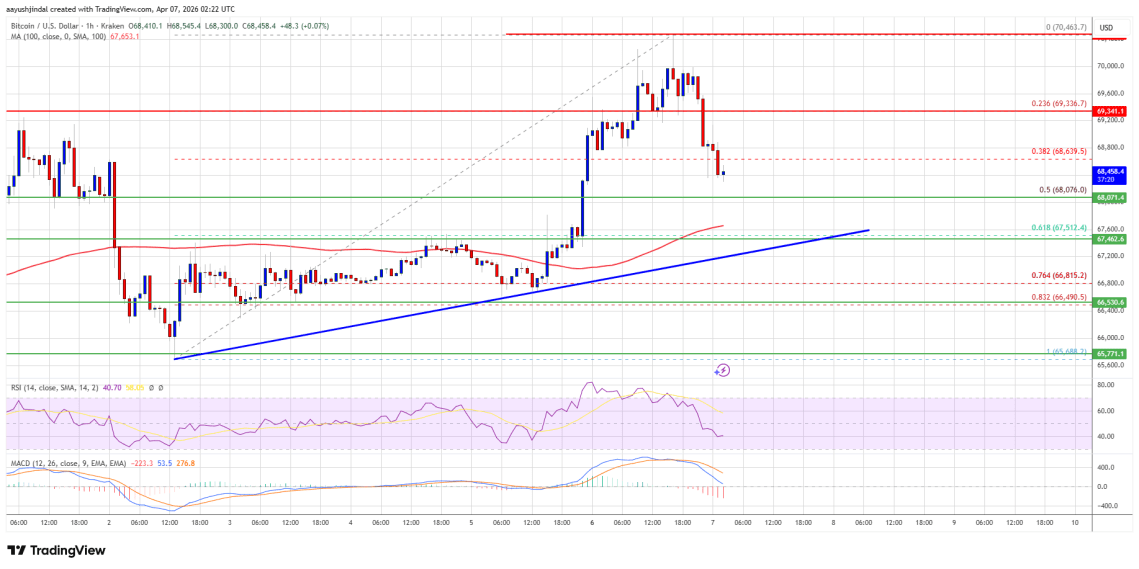
If the price remains stable above $67,500, it could attempt a fresh increase. Immediate resistance is near the $69,350 level. The first key resistance is near the $69,800 level. A close above the $69,800 resistance might send the price further higher. In the stated case, the price could rise and test the $70,500 resistance. Any more gains might send the price toward the $71,500 level. The next barrier for the bulls could be $72,000.
More Losses In $BTC?
If Bitcoin fails to rise above the $69,350 resistance zone, it could start another decline. Immediate support is near the $68,000 level. The first major support is near the $67,800 level.
The next support is now near the $67,500 zone or the 61.8% Fib retracement level of the upward move from the $65,688 swing low to the $70,463 high. Any more losses might send the price toward the $66,800 support in the near term. The main support now sits at $65,500, below which $BTC might struggle to recover in the near term.
Technical indicators:
Hourly MACD – The MACD is now gaining pace in the bearish zone.
Hourly RSI (Relative Strength Index) – The RSI for $BTC/USD is now below the 50 level.
Major Support Levels – $68,000, followed by $67,500.
Major Resistance Levels – $69,350 and $70,500.
Related Articles

Crypto RWA Perpetuals Challenge TradFi Market Share
Crypto-native perpetual markets tied to real-world assets ( RWA) are rapidly gaining traction against traditional futures. New data shows sharp growth in trading volumes...

Bitcoin Price Trims Gains, But Uptrend Still Holds Strong
Bitcoin price started a strong increase above the $70,500 zone. $BTC is consolidating gains and might aim for more gains above the $71,650 zone....

Cardano price tests $0.25 support as long liquidations mount, will it crash?
Cardano price fell over 5% towards $0.25 on Thursday, paring off a part of its gains seen on the previous day. According to data...

Crypto Built More Rails, but the Next Battle Is Over How Much Work a Dollar Can Do
Most people think the problem with modern finance comes down to fees, spreads, and slow transfers. Those are real, but the deeper issue feels...