Will XRP price break from its descending wedge at $1.31 as bearish momentum approaches exhaustion?

$XRP is compressing into the apex of a descending wedge at $1.3157 after months of lower highs and lower lows, with the 4H MACD signal line just crossing into positive territory for the first time since February — a sign that bearish momentum may be approaching exhaustion ahead of what could be the pattern’s most consequential candle close.
$XRP ($XRP) is trading at $1.3157 on April 3, 2026, down 0.33% on the day and compressing near the apex of a descending wedge pattern that has formed across both the daily and 4H timeframes since February. The Supertrend indicator on the daily chart sits at $1.4894, in red above price, confirming the prevailing bearish regime. Yet the formation itself is a structure that technical analysts typically associate with bullish reversal potential when it emerges at the end of a prolonged downtrend, provided the lower trendline holds.
On the daily chart, two converging trendlines are clearly visible: a descending upper resistance line and a slightly rising lower support line. Price at $1.3157 is nearing the apex, with the most recent daily low printed at $1.3033. The daily MACD shows a histogram of -0.0222, with the MACD line at -0.0287 below the signal at -0.0065. The reading remains bearish, but the histogram has been contracting, a sign that selling pressure is gradually fading.
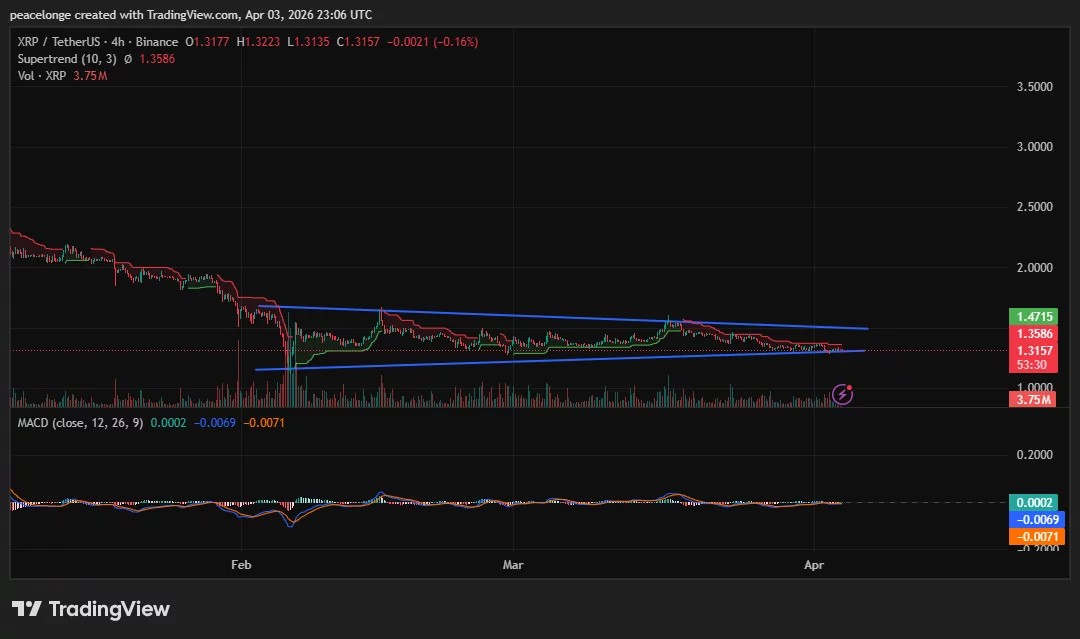
On the 4H chart, the same wedge structure is intact. The upper descending trendline aligns with the 4H Supertrend at $1.3586, and the lower rising trendline has provided support on each test since early February. Critically, the 4H signal line has crossed marginally into positive territory at 0.0002, while the MACD line at -0.0069 is approaching zero from below. A full bullish MACD crossover has not yet occurred, but the convergence at near-zero is an early signal of bearish exhaustion.
Key Levels, Price Targets, and Invalidation
Bull case: a daily close above the descending wedge resistance near $1.47 would confirm the breakout, initially targeting $1.4894, the Supertrend level, then $1.50. Above that, $1.60 is the key structural zone where the broader descending channel from July 2025 would be meaningfully challenged. Technical analyst Ali Martinez noted on X (formerly Twitter) that $XRP “could offer a short-term buying opportunity” within its multi-year ascending triangle structure at current levels, though he also identified a potential further decline of approximately 30% before a sustained long-term recovery becomes likely.
Bear case: a daily close below $1.27 would break the wedge support and expose $XRP to $1.14, the conservative channel breakdown target. A dense supply cluster of approximately 19.6 million $XRP is concentrated between $1.27 and $1.28, per Coinglass cost-basis data, making this the most critical demand zone to defend.
Invalidation of the bull case: a daily close below $1.27. Invalidation of the bear case: a daily close above $1.47.
On-Chain and Derivatives Context
U.S. spot $XRP ETF monthly inflows turned negative in March 2026 for the first time since the products launched in November 2025, according to SoSoValue data, removing a structural buy-side catalyst that had underpinned price through Q1. $XRP open interest across all exchanges now sits near $2.45 billion, down approximately 73% from the September 2025 peak, as detailed in prior crypto.news coverage.
Funding rates have shifted to a positive 0.008%, suggesting fresh long positions are entering near current levels. However, the six-to-twelve month holder cohort has begun trimming positions since March 27, reducing a layer of structural support precisely as the wedge reaches its apex.
As crypto.news has covered, recovery attempts have repeatedly stalled below descending resistance, and the pattern remains intact until buyers produce a decisive daily close above the wedge’s upper trendline. With the 4H signal line at zero and the apex approaching, the next directional candle carries outsized weight.
Related Articles
Ethereum Price Prediction – ETH Price Estimated to Reach $ 2,420.10 By Apr 14, 2026
Disclaimer: This is not investment advice. The information provided is for general purposes only. No information, materials, services and other content provided on this...

Bulls Fight To Defend the Key $80–82 Zone in the Latest Solana price Analysis
Traders are navigating a fragile bounce as the broader crypto market stays risk-off, making this a nuanced moment for any Solana price strategy. $SOL/$USDT...

Zcash explodes 23% – But a bigger move may be coming
Zcash’s [$ZEC] move starts with price, yet the drivers extend beyond a simple rally. $ZEC’s price rose to $329, gaining 23% in 24 hours...

Ethereum Price Clings to $2,120, Can Bulls Drive Fresh Surge?
Ethereum price extended gains above $2,265 before it started a downside correction. $ETH is now correcting gains and might find bids near the $2,120...