XRP Eyes $13 Price as Analyst Maps $0.90 Bear Market Floor From Multi-Year Pattern
Analyst Ali Martinez has pointed to a long-term structure forming on $XRP monthly chart, suggesting the asset could be preparing for a double-digit price run.
The bullish outlook comes as $XRP continues to hold around $1.42, losing over 1.1% of its earlier gains.
Key Points
- $XRP could target $13, as a multi-year ascending triangle signals strong long-term breakout potential.
- Analyst Ali Martinez identifies $0.90 as a key bear market floor before any sustained rally begins.
- Short-term downside risk remains, with $XRP dropping before building momentum for a larger move.
- Rare “Bull Switch” signal reappears, which has historically led to major rallies in 2017, 2021, and 2025.
Road to $13 $XRP
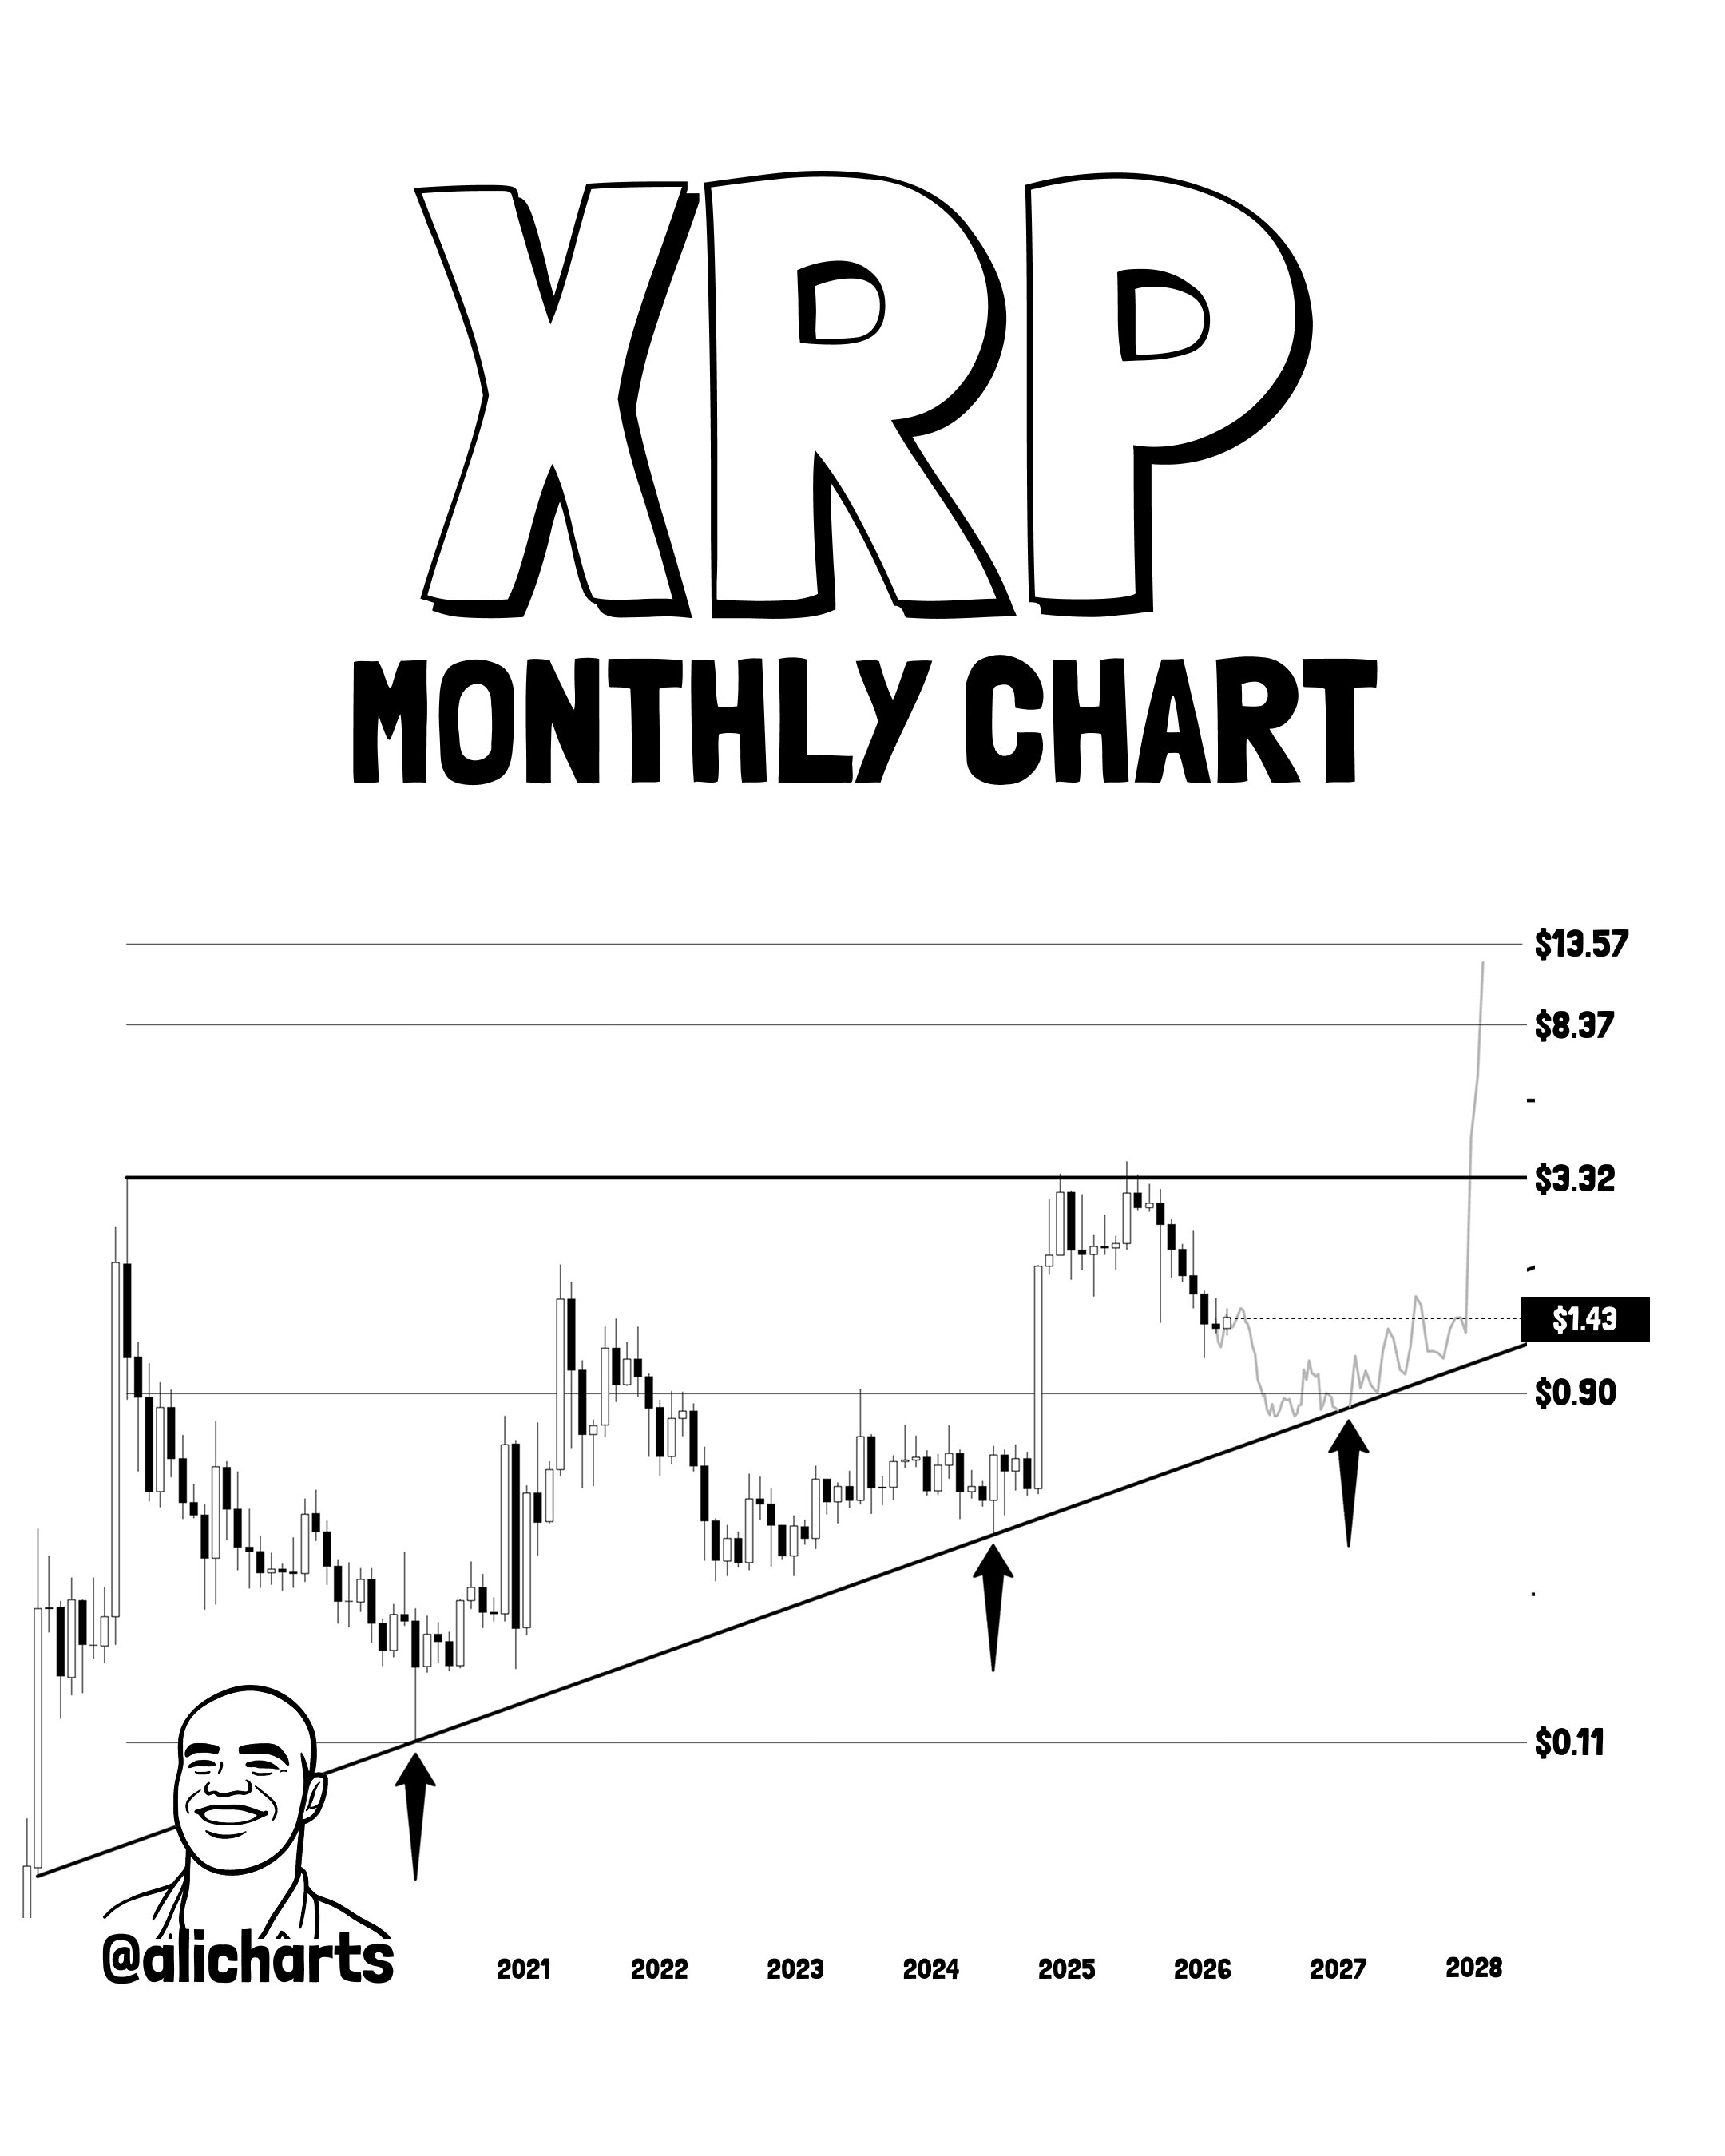
According to Martinez, $XRP has been trading within a massive ascending triangle that has developed over several years. This pattern shows a rising support trendline and a strong resistance zone near previous highs.
Based on this structure, he identifies a bear market bottom under $1, where the price could find strong support before any major move higher.
On the upside, the same formation projects a long-term breakout target of around $13. From today’s price, $XRP holders are looking at a price surge of over 9x.
Short-Term Risk Before a Bigger Move
Despite the bullish long-term outlook, the analysis suggests $XRP may still face near-term downside pressure. Specifically, Martinez stated that $XRP’s price could drop toward the $0.90 zone before any sustained rally begins. He considers this level a potential bottom for the next upward wave.
At the time of analysis, $XRP is trading around $1.43, with a 5% gain over the past month. While the $2 and $3.32 regions remain key barriers, Martinez’s chart shows that a strong momentum may easily overcome these resistance levels and establish a new peak in the double-digit range.
 Commenting on the analysis, popular $XRP market watcher ChartNerd approved it, saying it makes logical sense for $XRP’s path. He has repeatedly argued that $XRP’s price could fall to the $0.70–$1 range before the next major leg up.
Other Technical Patterns Calling for $10+ $XRP
Meanwhile, in a recent separate statement, ChartNerd highlighted additional technical structures that make a bullish case for $XRP’s price.
Specifically, he said a rare $XRP signal called the “Bull Switch” has reappeared. He noted that it has only shown up three times in 13 years, each followed by a major rally in 2017, 2021, and 2025.
The pattern typically marks a shift from bearish to bullish momentum after long consolidation phases. With $XRP recently recovering from a drop between $3.66 and $1.11, the signal suggests a possible new uptrend. It indicates that $XRP may be preparing for another breakout.
However, unlike Martinez, ChartNerd did not provide a short-term price target for $XRP based on this technical observation.
In another analysis, EGRAG argued that $XRP remains within its long-term “Bifrost Bridge” channel dating back to 2014, keeping the broader uptrend intact despite recent declines. He insists $XRP can reach a $13 target, which aligns with Martinez’s projection.
Related Articles
XRP Monthly EMA and Elliot Wave Setup Target $15-$31
$XRP targets unprecedented prices, spurred by the combination of strength around a key support and an Elliott Wave formation on the monthly chart. Notably,...

ETH price up 10% in April, so why is Ethereum Foundation selling?
ETH price up 10% in April, so why is Ethereum Foundation selling?

TD Cowen reiterates buy rating on Smarter Web Company, says it remains UK’s only scaled bitcoin treasury vehicle
TD Cowen reiterates buy rating on Smarter Web Company, says it remains UK’s only scaled bitcoin treasury vehicle
Analyzing 30% Gap to 200-Day Moving Average
The $XRP market is showing signs of a long-awaited reversal as, after prolonged pressure observed since the beginning of the year, a “golden cross”...